
The Power Platform admin centre provides a unified portal for Local Administrators (LAs) to manage their environments. By leveraging the out-of-the-box reports and analytics, an LA can gain a clear picture of the applications and flows that exist within their dedicated environment.
It is the responsibility of the LA is to manage their organisation’s dedicated environment, and it is best practice to monitor the following on a regular basis:
- Logs and Audit Records
- Capacity
- Dataverse Analytics
- Power Apps Analytics
- Power Automate Analytics
In the following sections we will expand on these areas in greater detail.
To understand more about the responsibilities and security roles of an LA, please see the Control and Management section.
Note, if you require further information on the licences allocated to your organisation, please email the NHSmail Helpdesk (with ‘Power Platform Allocated Licences’ in the subject line).
Audit Logs
Audit logs provide visibility of who is using applications and flows, as well as how they are being used, which is important for monitoring adoption and security.
Audit Logs can be accessed through the Office 365 Security & Compliance Centre which provides full log and audit records for Power Apps and Power Automate.
Local Administrators (LAs) can view audit logs for their dedicated environment following these steps:

- Sign in to the Power Platform admin centre with your NHSmail credentials.
- Select Environment.
- Navigate to details and then click Configuration.
- Expand Audit and logs
- Click Audit summary view
Audit logs can be filtered by change date, event, and other properties.
 By clicking on the links displayed in the columns, you will be able to see further information regarding that log entry. For example, in the screenshot below, we can see further details regarding the Share event that took place through Microsoft Flow (i.e. Power Automate).
Capacity
Overview
Local Administrators (LAs) are responsible for managing Dataverse storage capacity for their dedicated environment. You can choose to free up storage, delete unwanted environments, or buy more capacity to be compliant with storage usage.
For more information on capacity limits, please see the Power Platform Environments section.
Dataverse storage capacity is made up of 3 key metrics:
- Dataverse for Apps Database Capacity
- Dataverse for Apps File Capacity
- Dataverse for Apps Log Capacity
For more Microsoft information on Dataverse storage capacity, including what contributes to these capacity metrics, visit the Microsoft Dataverse storage capacity website.
View Capacity Reports
Summary View
Local Administrators (LAs) can view the current total capacity and the utilisation reports of their environment within the Resources view of Power Platform Admin centre.
To view capacity reports, follow these steps:
- Sign in to the Power Platform admin centre.
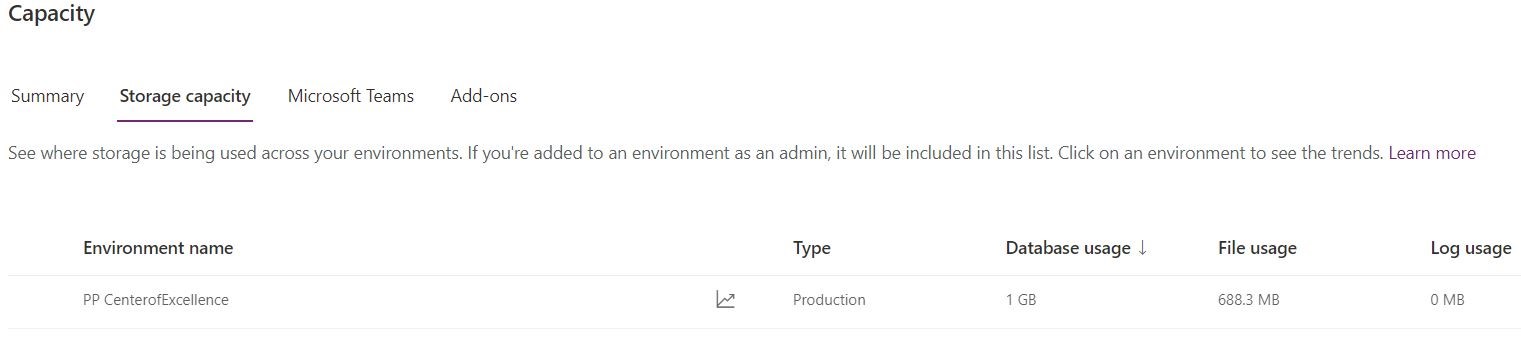
- Select Resources > Capacity > Storage Capacity Tab.
- View the three metrics for the dedicated environment on the Storage Capacity Tab.
Environment Capacity Analytics
This page within the Power Platform admin centre provides an environment-level detailed view of where your organisation is using capacity, and Dataverse storage capacity.
To view an organisation’s environment capacity analytics:
- Select Resources > Capacity > Storage capacity.
- View your dedicated environment.
- Select Details ().
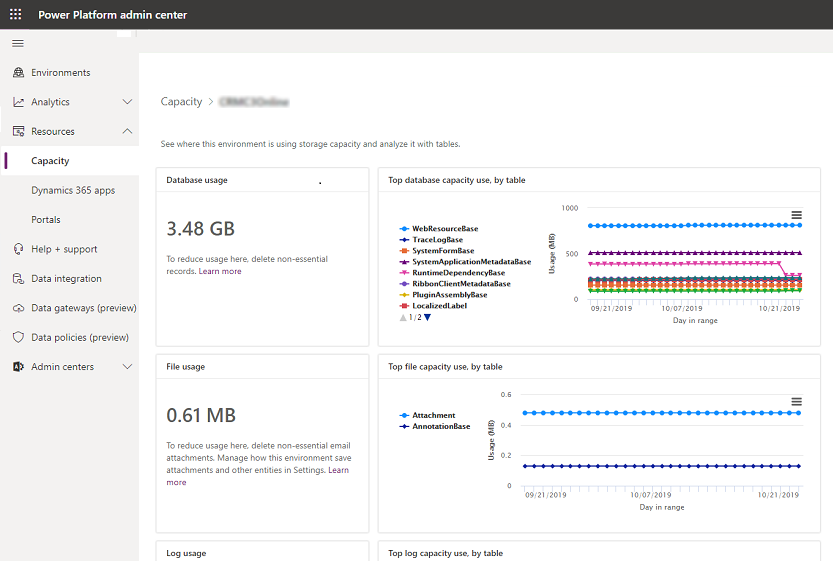
In this report you can view the following analytics:
- Actual database usage
- Top database tables and their growth over time
- Actual file usage
- Top files tables and their growth over time
- Actual log usage
- Top tables and their growth over time
Analytics
Overview
You can view Dataverse, Power Apps or Power Automate analytics in the Power Platform admin centre.
Note: Dataverse was previously called the Common Data Service. Microsoft is in the process of renaming across the platform and both names may still be in use. For more information on Dataverse and Common Data Service please see Microsoft’s guidance.
To find analytics on Power Apps, Power Automate or Dataverse follow these steps:
- Select Analytics from the navigation pane.
- Select from either Dataverse, Power Apps or Power Automate
- View the reports on the right-hand side.
 The following reports contain a filter that shows one Dataverse Environment at a time.
A Local Administrator (LA) will only see analytics on databases they have access to.
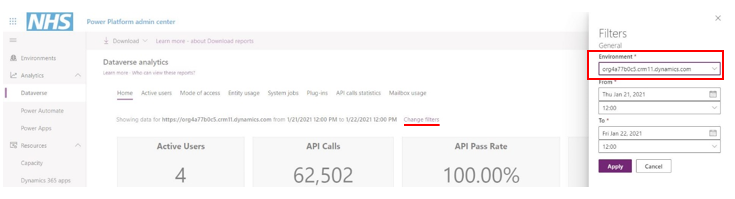
Dataverse Analytics
Dataverse reports provide high-level dashboards on active users, API calls and pass rate, entity usage and more.
An LA can view these dashboards to quickly understand the adoption and user metrics for their organisation.
The following is a short breakdown of key dashboards. LAs can download any report as an Excel file by selecting Download in the top left of the tab.
| Reports | Description | Metrics |
| Active users | Report on how many users are active within the dedicated environment | Active users, users create, read, update, delete (CRUD) statistics and more. |
| Mode of access | Report on how users are accessing the power platform environment | Operating System Access, Device Type, Security role, Business unit and more. |
| Entity (Table) usage | Which entities (tables) in the Power platform are being used most frequently | Entity CRUD statistics. |
| System Jobs | Dashboard to monitor and troubleshoot workflows. Frequency updates every 24 hours | System jobs pass rate and throughput per hour. |
| Plug ins | Use this dashboard to monitor and troubleshoot plug-ins. Frequency updates every 24 hours | Sandbox pass rate and plug-in execution. |
| API Call statistics | Use this dashboard to monitor and troubleshoot API calls. Frequency updates every 24 hours | API success rate, total API calls and more. |
| Mailbox usage | Use this dashboard to monitor email mailbox usage. Frequency updates every 24 hours | Mailbox Usage and more. |
For additional information on different chart elements, please see the Microsoft’s information on the analytics dashboard.
Power Apps Analytics
Power Apps analytic reports provide a view into application usage, errors and service performance within an environment. These reports are available for Canvas Apps only and not available for Model-driven Apps.
The following is a short breakdown of each report and LAs can download them by selecting the ellipsis and then select Export data.
| Reports | Description | Metrics |
| Usage Reports | Report provides total app launches and daily active users across all apps in the environment. | Filter view with attributes like device platform, player version, country, state, and city. |
| Location | Report provides a map-based view of usage. It gives an insight into regional adoption and usage trends. | Map location by region. |
| Toast errors | Report on toast errors – errors displayed to the end users of the app. | Toast error trends, types, and counts per app. |
| Service Performance | Report provides details of all standard and custom connectors | Connectors used in the environment, success rates of connection and more. |
| Connectors | Report provides visibility into the standard and custom connectors being used by canvas apps within the last 28 days of data | Number of connectors associated with each app, the specific connectors being used by each app, and the owner of the connector. |
For additional information on Power Apps analytics, please see Microsoft’s Admin Analytics for Power Apps.
Power Automate Analytics
Power Automate analytics reports provide insights on runs, usage, types of flows created for cloud and Desktop/UI flows and errors, shared flows, and details on connectors associated with all the different cloud flow types.
The following is a short breakdown of each report and LAs can download them by selecting the ellipsis and then select Export data.
| Reports | Description | Metrics |
| Runs | Report provides a view into the run data of all flows in an environment | Daily, weekly, and monthly reports available. |
| Usage | Report provides insights into the different types of flows in use | Types of flows in use, trends, and the flow in use names. |
| Created | Report provides insights into the types of flows created, trends, and details like the created date and the creator’s email address. | Types of flows created, trends, and the flow creators’ names. |
| Errors | Report provides insights into recurring error types and details | Error count, creator’s email address, last occurred time, and more. |
| Shared | Report provides details on the flows shared and trends in the environment | Flows shared, types of flows shared, and more. |
| Connectors | Report provides details on connectors and their associated flows | Number of calls from each flow per connector, flow runs, and the flow creator’s email address. |
For additional information on Power Automate analytics, please see Microsoft’s Analytics for Cloud flows and Microsoft’s analytics for UI flows.
| Last Reviewed Date | 03/11/2021 |